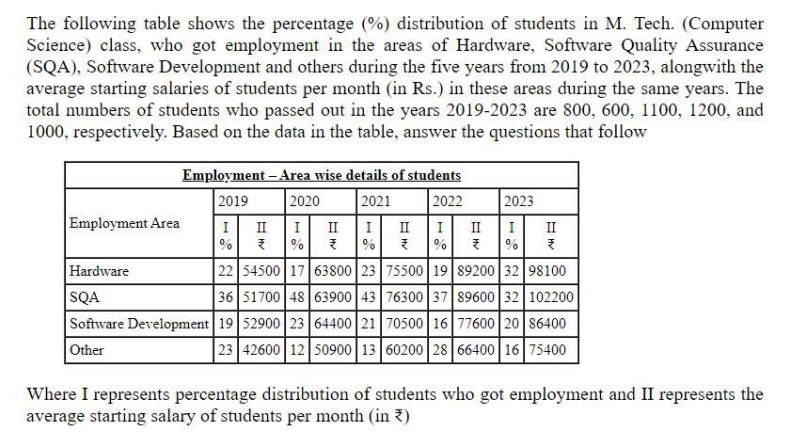
Hardware:
2019: 22% of 800 = 176
2020: 17% of 600 = 102
2021: 23% of 1100 = 253
2022: 19% of 1200 = 228
2023: 32% of 1000 = 320
Total Hardware: 176 + 102 + 253 + 228 + 320 = 1079
SQA:
2019: 36% of 800 = 288
2020: 48% of 600 = 288
2021: 43% of 1100 = 473
2022: 37% of 1200 = 444
2023: 32% of 1000 = 320
Total SQA: 288 + 288 + 473 + 444 + 320 = 1813
Difference:
Total SQA - Total Hardware = 1813 - 1079 = 734
Therefore, the number of students getting employment in Hardware is 734 less than the number of students getting employment in SQA.
हार्डवेयर:
2019: 800 का 22% = 176
2020: 600 का 17% = 102
2021: 1100 का 23% = 253
2022: 1200 का 19% = 228
2023: 1000 का 32% = 320
कुल हार्डवेयर: 176 + 102 + 253 + 228 + 320 = 1079
एसक्यूए:
2019: 800 का 36% = 288
2020: 600 का 48% = 288
2021: 1100 का 43% = 473
2022: 1200 का 37% = 444
2023: 1000 का 32% = 320
कुल एसक्यूए: 288 + 288 + 473 + 444 + 320 = 1813
अंतर:
कुल एसक्यूए - कुल हार्डवेयर = 1813 - 1079 = 734
इसलिए, हार्डवेयर में रोजगार पाने वाले छात्रों की संख्या SQA में रोजगार पाने वाले छात्रों की संख्या से 734 कम है।

 Year-wise PYQs